For years my internet provider was XS4ALL, which started in the ’90s from a small hacker group and was one of the first providers in the Netherlands. It has always been a provider with a strong ethical background.
The Church of Scientology sued XS4all in the past for not wanting to take unwanted information about them offline, and the internet provider has often acted proactively due to privacy issues.
In the early 2000s, KPN bought the company, but the brand and organization still survived, and they have kept it alive until last year. KPN has chosen to consolidate all its brand names under the KPN name, including XS4ALL. Many fear this will mean the end of the XS4all spirit, and concerned customers and loyal employees started a new provider: Freedom Internet!
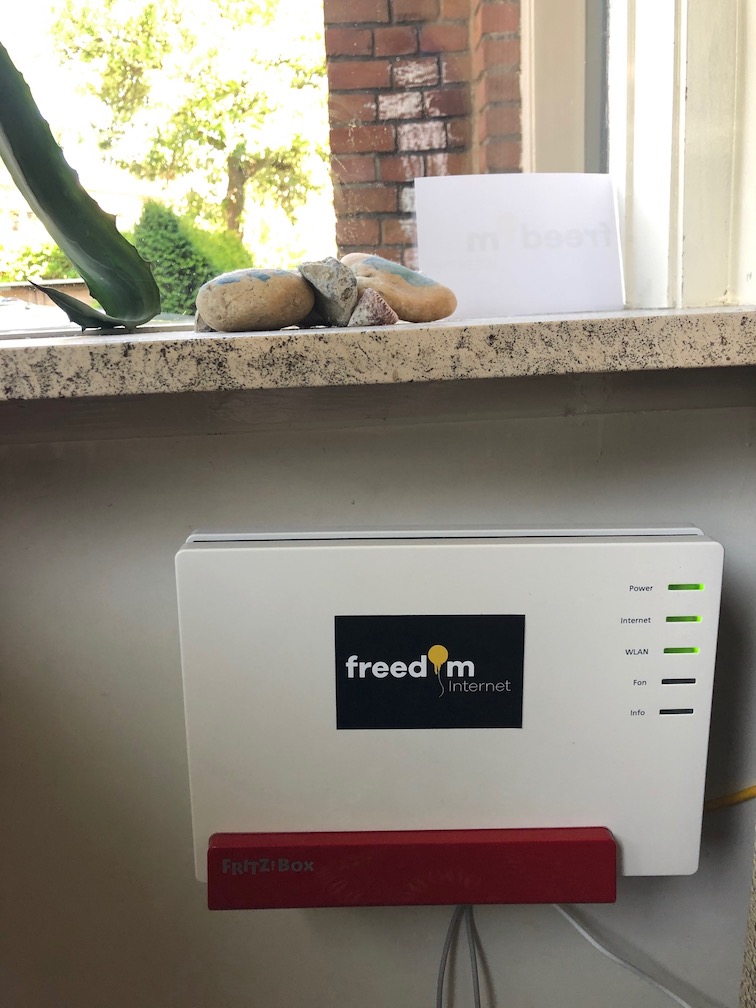
I joined them as a founder and small time investor and am now one of the lucky 128 first connected customers!
{% raw %}
<div id="chart"></div>
<div id="grid"></div>

<script src="https://code.datagridxl.com/datagridxl.js"></script>
<!-- amCharts (chart plugin) -->
<script src="https://www.amcharts.com/lib/3/amcharts.js"></script>
<script src="https://www.amcharts.com/lib/3/serial.js"></script>
<script>
var my_data = [{
  "country": "USA",
  "visits": 2025
}, {
  "country": "China",
  "visits": 1882
}, {
  "country": "Japan",
  "visits": 1809
}, {
  "country": "Germany",
  "visits": 1422
}, {
  "country": "India",
  "visits": 1522
}, {
  "country": "Netherlands",
  "visits": 1542
}];

var grid;
var chart;

createGrid();
createChart();

function createGrid(){

  grid = new DataGridXL("grid", {
    data: my_data,
    allowColDelete: false,
    allowColInsert: false,
    allowCellFill: false
  });

  grid.events.on("cellvaluechange", function(e){

    setTimeout(function(){
      chart.dataProvider = grid.getData();
      chart.validateData();
      chart.animateAgain();
    },25);

  });

}

function createChart(){

  chart = AmCharts.makeChart( "chart", {
    "type": "serial",
    "theme": "none",
    "dataProvider": my_data,
    "categoryField": "country",
    "startDuration": 1,
    "graphs": [ {
      "balloonText": "[[category]]: [[value]]",
      "fillAlphas": 0.8,
      "lineAlpha": 0.2,
      "type": "column",
      "valueField": "visits",
      "fillColors": "#cbe4ff",
      "lineColor": "#cbe4ff"
    } ],
    "chartCursor": {
      "categoryBalloonEnabled": false,
      "cursorAlpha": 0,
      "zoomable": false
    }
  } );

}


</script>
{% endraw %}